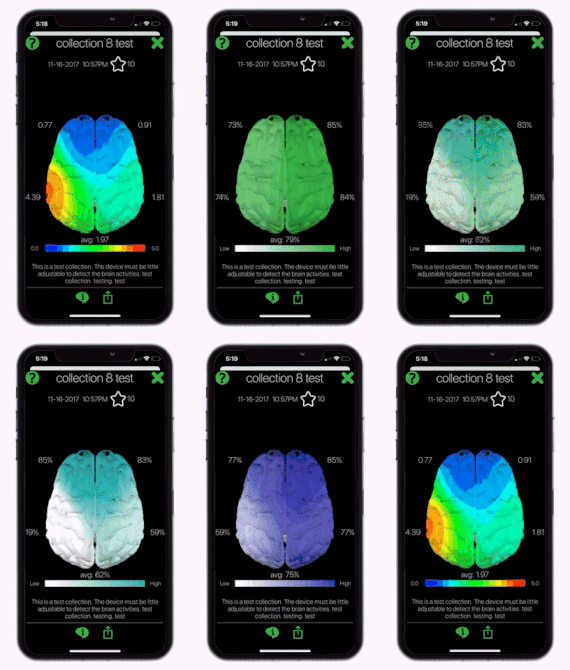
Mapping a single collection.
In the center of the screen are the brain maps you created. Overlaid on top of the maps are labels showing the electrode values.
Above the maps is the collection title, date and either your Opti Brain rating or the Opti Index percentage given in Opti Train, Calm or Confidence.
Below the maps is a color gradient key and any notes that you recorded.

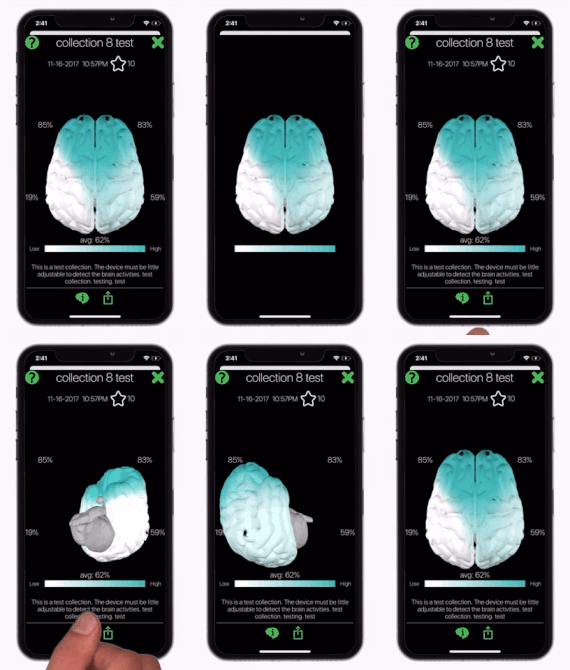
Use gestures to view different angles of you map.
Tap once on the screen to hide all the labels. Tap again for them to reappear.
Drag right, left, up or down to rotate the brain maps. Double tap on the screen to return the maps to their original orientation.

The bottom of the screen has multiple controls depending on what type of map you are viewing.
Select the information button on the bottom of the screen to read additional information about your brain maps.
Select the share button to save or share your maps.
In movie mode you can play or pause the video or drag the circle to search for a particular second of maps.
Select the X in the top right of the screen to exit the maps.

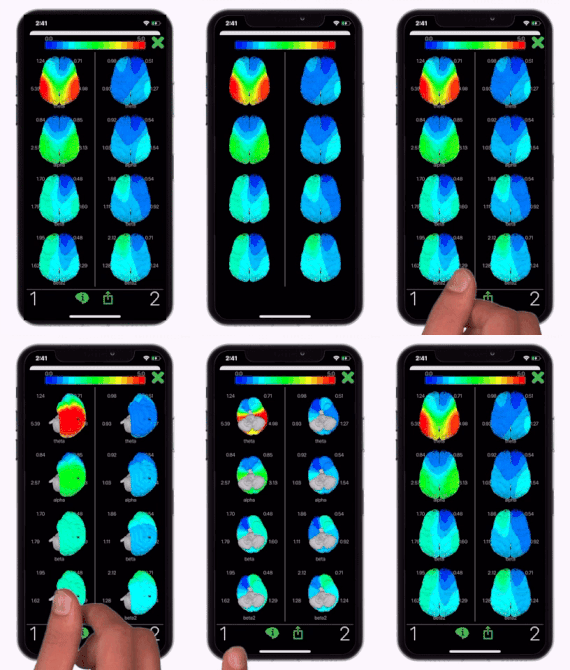
You have the option of mapping two data collections at the same time to compare them.
When doing so, the left side of the screen is the first collection you chose to map labeled as 1. The right side of the screen is the second collection labeled as 2.
Above the map(s) is a color gradient key.
Select the information button on the bottom of the screen to read additional information about your brain maps. Here is where you can see the collection titles, dates, Opti Brain ratings, Opti Indexes, and any notes recorded.
All other features are the same as is a single collection brain map.


