
Built From Performance Backwards
Opti is based on over 30 years of research done by Debbie Crews, Ph.D. during her mental coaching career as an LPGA golf trainer. Brain activity was monitored with an electroencephalogram (EEG) during tens of thousands of putts during her research of performance optimization. Her findings have lead to the development of patented brain training programs to help you BETTER YOUR BEST®! Three published studies testing the effects of Opti Train showed a 22% increase in the average putts made following 15 Opti Train trials. Purchase an Opti Subscription Package to start training your brain today!
Opti has also been inspired by the research of other brilliant minds that Debbie Crews has collaborated with. Below are some links to some of the research that has lead to the inspiration of Opti Brain’s performance optimization software:
Performance of Surgeons – Haptic System to Alert Users Before Impending Human Errors
The Effectiveness of EEG Biofeedback, Relaxation, and Imagery Training on Golf Putting Performance
Golf Digest 2010 – How to Train Your Brain
http://comparison-of-two-neurofeedback-strategies
https://www.myoptibrain.com/effects-of-brain-synchronization-training
https://www.myoptibrain.com/opti-brain-school-projects/
https://www.myoptibrain.com/opti-neurofeedback-for-addiction
https://www.myoptibrain.com/wp-content/uploads/2020/05/Kathy-Gook-Abstract-1.pdf
Opti Brain Training Proof of Concept
Brain Training Results Pilot Study Using the Opti Brain and Opti Train Apps
Debbie Crews, Ph.D.
Three highly skilled golfers completed three Opti training sessions. Session 1 included a resting EEG recorded by the Opti Brain app for 30s and ten, 10-ft putt Opti Brain evlautaion putts (baseline). This was followed by one, 30 putt set while using the neurofeedback provided in the Opti Train app. Session 2 included two, 30 Opti Train putt sets (60 total training putts). Session 3 included two, 30 Opti Train putt sets (60 total training putts) plus ten, 10-ft putts recorded in the Opti Brain app for post evaluation.
The following four graphs illustrate the pre to post changes in putting and synergy during the 10 pre and 10 post Opti Brain putts. The last two graphs show the progression of performance across the five, 30 Opti Train putt sets.
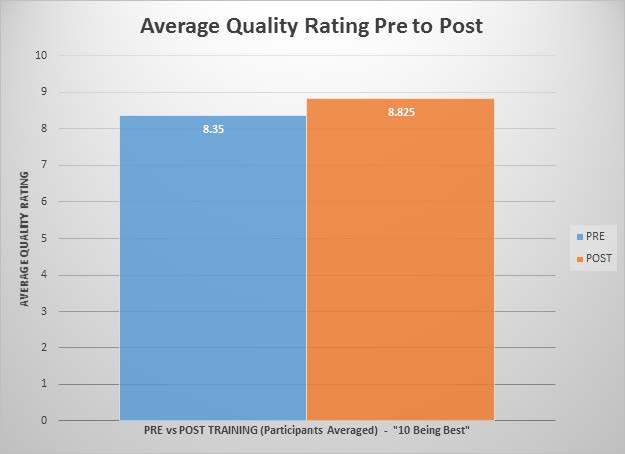
The subjective quality of feel increased almost .5 or 20% on average for the 3 golfers.
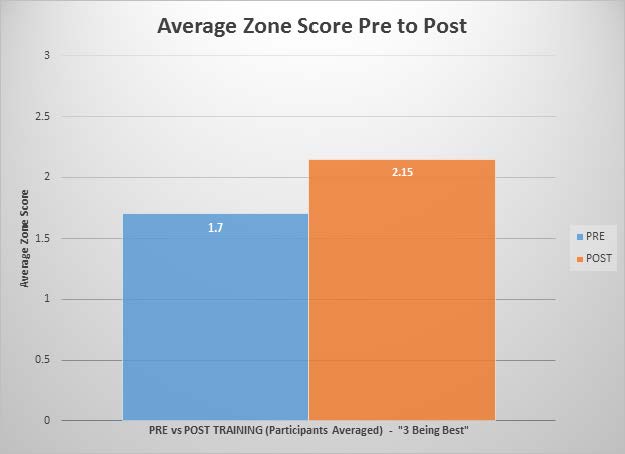
The objective outcome of the each putt was scored in zones. A successful putt = 3, within 10 cm of the hole = 2, within 20 cm of hole = 1 and outside 20 cm == 0. The 3 golfers increased their average objective score by .45 or 15%.
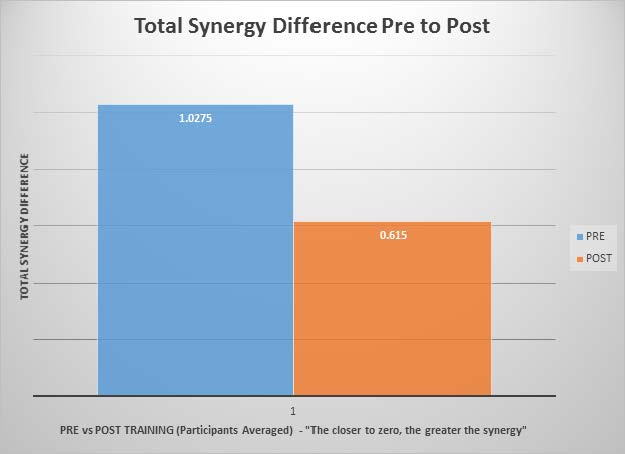
A reduction in difference among the 4 sensors measured in theta, alpha, beta and beta2 of .4125 represents an increase in synergy of 40% following 150 Opti Training putts. This measure was taken during the ten, 10ft pre and post Opti Brain evaluation putts that did not include training.
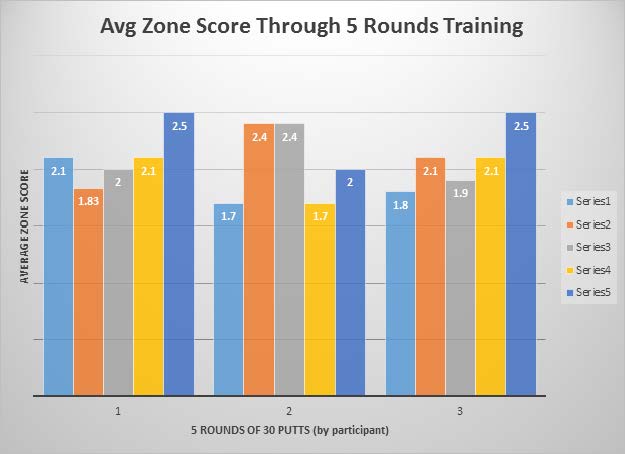
Series 1-5 represent the five, 30 Opti Train putt sets for Golfer 1, 2 and 3. The 3 golfers increased their average zone score during training 22%, 23% and 23%, respectively (from their low to their high score). Golfer 2 combined session 2 and 3 doing 120 putts in one session. This explains his high score occurring after session 2. His performance declined the final 60 trials probably due to fatigue (focus).
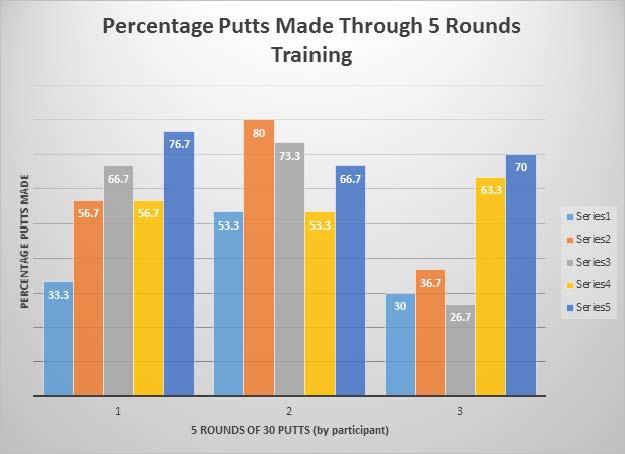
The percentage of putts made during Opti Training increased 43.4%, 26.7% and 43.3%, respectively (from their low to their high score). The highest score was the last set of 30 training putts except for Golfer 2 who became fatigued the final 60 putts. Making 70-80% of 10 ft putts shows a high degree of success.
Effects of Opti Brain Training Feedback on Golf Putting Performance
Debbie Crews, Ph.D.
Golf putting is a task that can be performed by most anyone; young and old, skilled and unskilled. However, at the professional tour level it is putting that most often differentiates the winners from the rest of the tour. It was the purpose of this investigation to determine the effect of the Opti feedback system on golf putting of novice to PGA tour winner golfers.
Twenty-six individuals (male = 18, female = 8) volunteered to participate in this investigation. The average age of the participants was 38.42 + 15.73 (range 14-81) years and the average handicap was 8.46 + 14.54 (range +5-40). Total years playing golf was 22.92 + 14.82 (range 0-68) and total years competing was 12.81 + 14.72 (range 5-40).
Golfers putt 20, 12ft putts on an indoor putting mat as their baseline measure. Quality of feel (1-10, 10 is high), cm error and total putts made were recorded for each putt. Golfers were then randomly assigned to experimental or control condition. Experimental participants learned the Opti feedback system for 5 trials (in a putting stance with no ball) and then used the feedback system while putting the next 15 balls. Control participants simply putted another 15 balls.
The feedback system algorithm was designed to divide their baseline putts into three levels of performance (thirds). Music volume was assigned to each level (loud, medium and soft). The EEG (14 brain locations), balance (4 sensors under each foot) and club (X, Y, Z accelerometer) pattern associated with worst putts (quality and error) was fed back to the golfer as loud music. Medium music was fed back when her brain pattern equated the brain, balance and club pattern of her middle performance putts from baseline. Soft music represented the brain, balance and club pattern of the best performance putts from baseline. Every training trial started with load music and then changed if the EEG, balance, and performance data warranted medium or soft music.
The golfer was instructed that their real time brain, balance and club data was running the feedback program and to use their normal putting routine. Their goal was to have the music soft right before they initiated the stroke. If the music was not soft they were instructed to wait or find a way to lower the volume before starting the stroke.
Golfers did not rate the quality nor was the performance measured for the 15 training putts for either experimental or control golfers. Following the 15 training trials all golfers putt 10 posttest trials in which they once again rated the quality of each putt, and cm error and number of putts made were recorded.
Results
Results indicated that both the experimental and control participants significantly, F(1,24) = 4.71, p = .04, increased the number of putts made and significantly, F(1,24) = 9.61, p = .005, reduced the cm error from baseline to the posttest. “Quality of putts” improved for both groups but the results were not significant. There was no significant interaction between groups from the pre- to posttest measures. However, the Opti feedback group made 16% more putts than the physical practice control group. The effect size for the experimental group for putts made was .75 (large) compared to .44 (moderate) for controls. The reduction in cm error was 10% greater for the Opti feedback group (34%) compared to the control group (24%). The cm error effect size for Opti feedback golfers was .66 compared to .47 for controls. Lastly, the quality rating for putts improved 3% for Opti feedback golfers compared to 1% among controls.
While the interaction effects were not significant, the large effect size (indicating the meaningfulness of the result) and the practical application of a 16% increase in putts made is important. In a round of golf in which the golfer has 36 putts (2 per hole), a 16 % increase in putts made is equal to 5.76 less strokes.