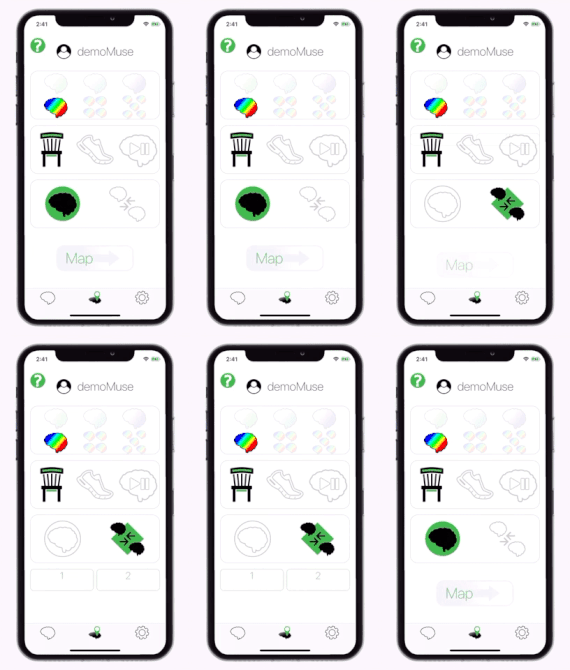
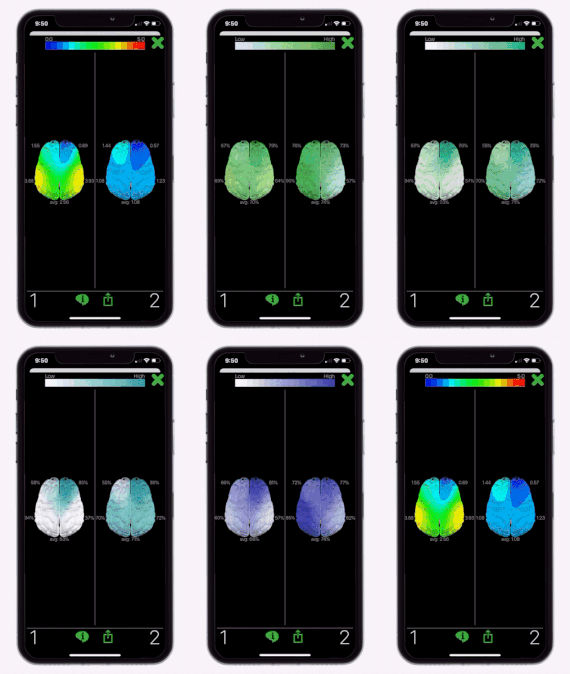
A powerful tool Opti Brain offers is to analyze the brain maps from two sets of data collections at the same time. Select the icon featuring two brains to turn on compare collections. Then tap either button 1 or button 2 to select a brain data collection. Last tap the Map button to create the maps.

Before and After
A helpful method of comparing maps is to take a resting measure before and after an event, action or mood change. An example of this is to take resting measurements before and after a performance, a work out, a motivational speech, therapy, a massage, or a stressful situation. Map both resting collections next to each other and look for patterns.
Comparing Performances
When it comes to performance, the compare maps option is most useful when mapping great performance brain maps vs. poor performance brain maps. Look for brain patterns and remember how you felt during each collection. What events or thoughts brought you to create the brain pattern in both collections. Can you recreate the scenario? If so, do the brain maps look similar?
Quality Rating
It is common to record many consecutive brain data collections in a short period of time when trying to catch a great performance. For example, when you are putting a golf ball you can collect data during1–or even 20–putts to get a good amount of both great and poor shots. With so many collections, how can you remember which collections are which? That is what the quality rating is for!
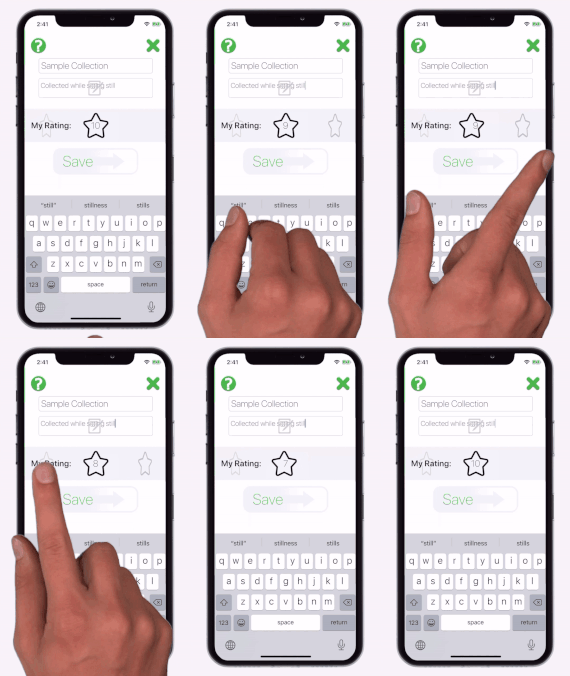
After you complete a data collection, you will see a ‘save as’ screen. On this screen is a view with multiple star icons you can scroll through. This is where you set your quality rating for that collection. Ten represents a great performance and zero represents your worst performance. After each collection choose a rating. In addition, add any other identifying comments (e.g. score or outcome of performance) to the notes section.
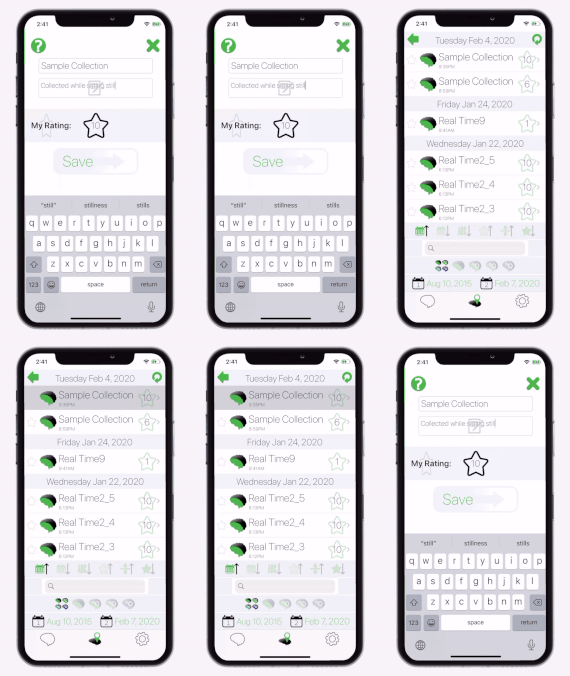
When you go to the mapping tab to choose a collection to map, you will see the quality on the far right side of each cell. This will easily indicate which performances were your best and which were your worst so that they can be compared.


