
Your total brain activity is the total amount of electrical activity produced by your brain. Warm colors correspond to high brain activity and cold colors represents low brain activity. If the map shows red your brain is fast at work in that area! We are interested in both the amount of activity a brain map shows and in finding patterns in the colors.

Since the Total Brain Activity maps represent all the power detected in the brain during 1 second of data, it is easiest to divide the brain into significant geographical locations when looking for patterns. Activity in specific locations of the brain can be significant indicators of the type of functions going on in your brain.
It is also very popular to divide the brain into power bands (or levels of thought) and divide the brain by thought processing type instead of geographical location. This topic is a little more advanced and is covered in the Opti Brain tutorial named Levels of Thought (Power Bands).
Right vs. Left Brain Activity
Your left side of the brain correlates with analytical thoughts, logical reasoning, and can focus on details. The right side of the brain is more creative, emotional, and can see the whole picture. When one side is significantly warmer in color than the other, those feelings and thoughts are activated. If the right and left sides are about the same color in a brain map it indicates both types of thought are being used and the brain is balanced.
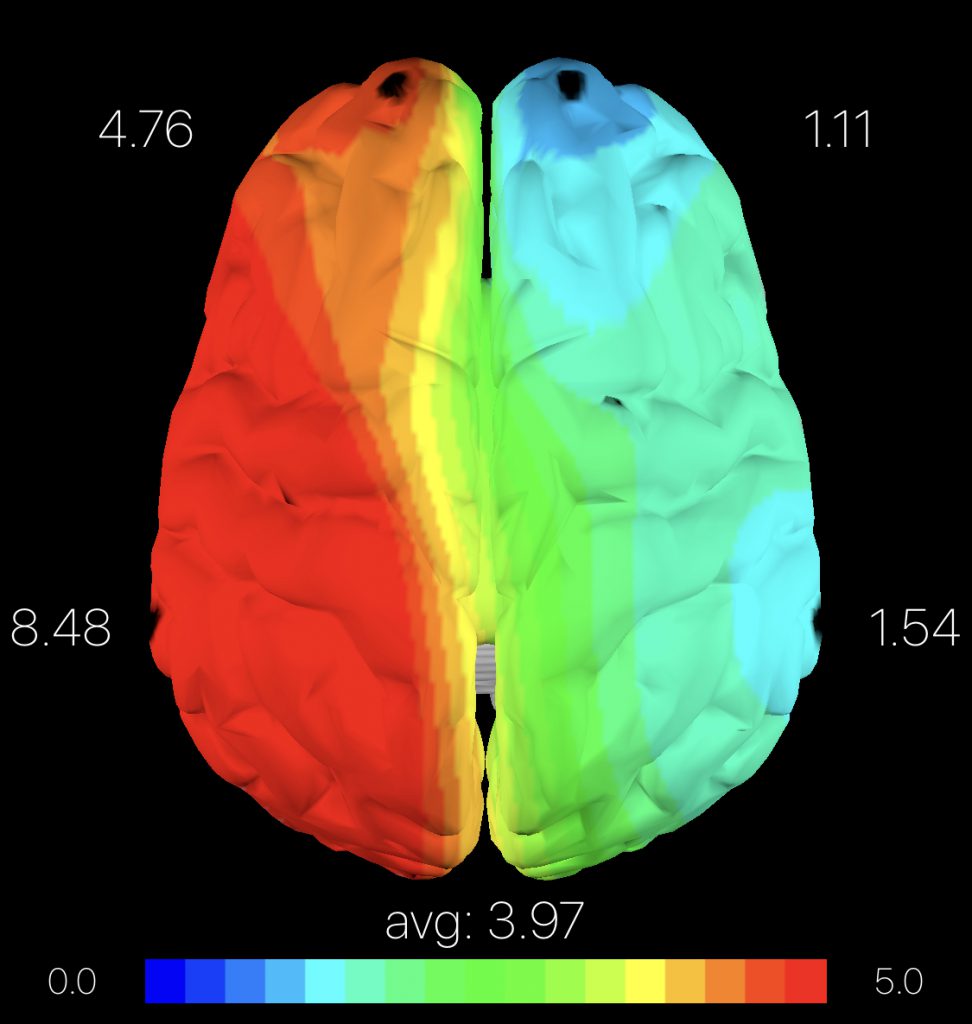
Left Sided 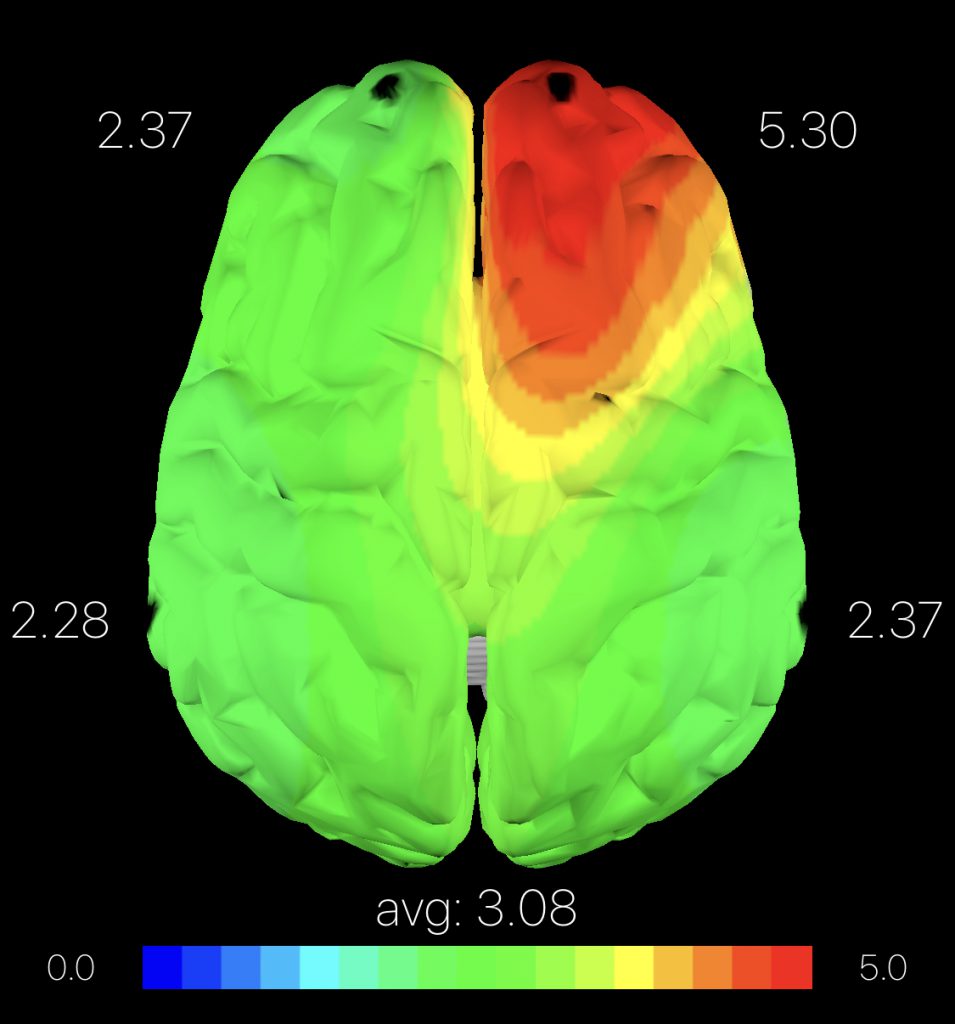
Right Sided
Front vs Back
Your brain can also be divided into the front half vs the back half. When the front of your brain is activated you are in command mode. This means you are able to make commanding decisions not influenced by your emotions. When the back of your brain has warmer brain activity than the front, you are more emotional. This means the decisions you are making are being influenced by your emotions.
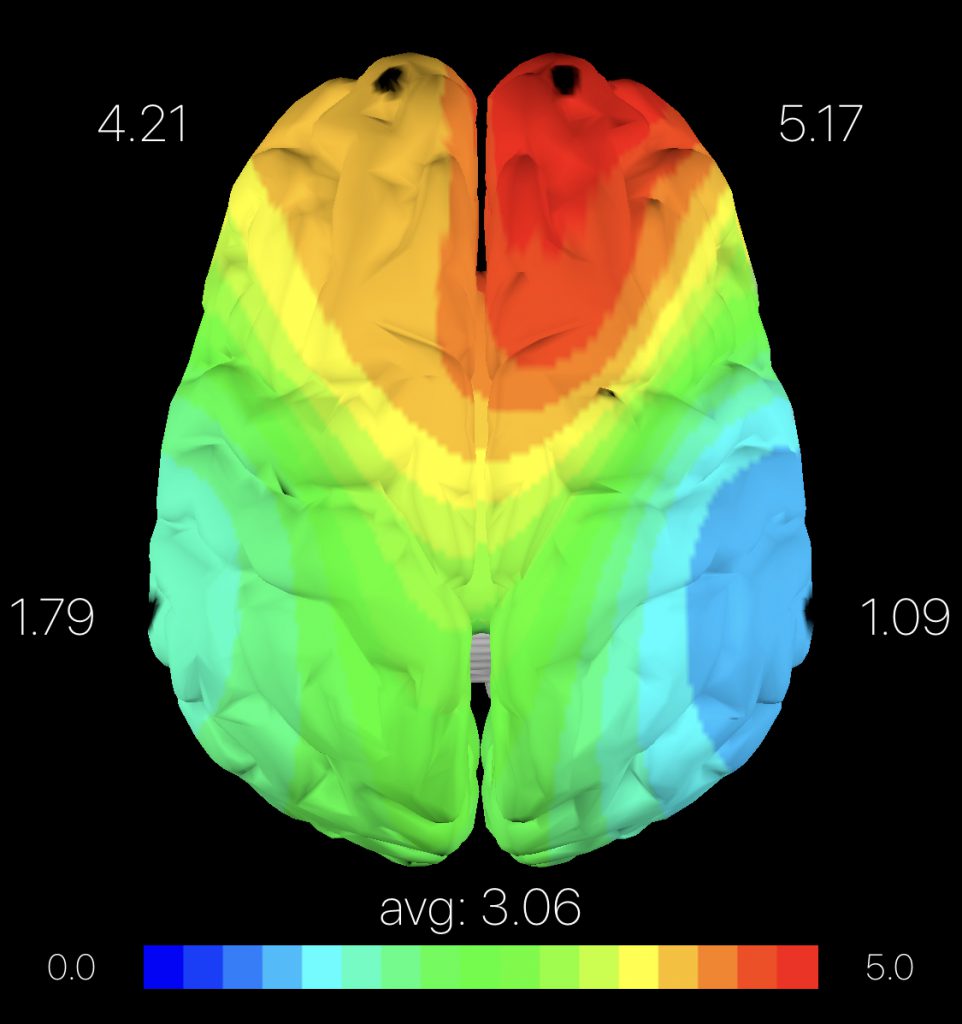
Front 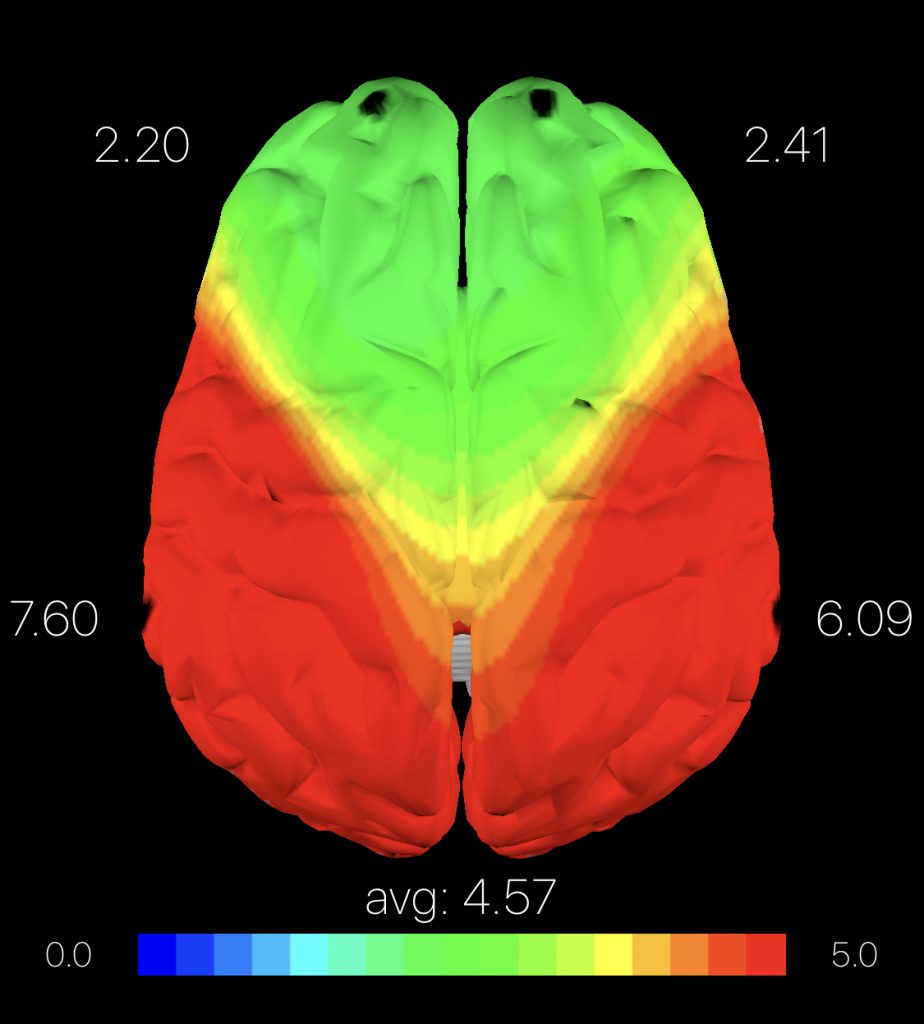
Back
Brain Function by Location
The brain is also divided into areas that perform different functions. For example, the Muse Brain Sensing Headset has four electrodes that pick up brain activity. In the Opti Brain app, the electrode positions are represented by black dots on the brain maps. The two electrodes at the top of the brain map represent executive function processing and focus of attention. When these two locations have high activity those types of thoughts are present. The two electrodes at the side of the brain map represent auditory processing, balance and possibly anxiety. The left is more “thinking” (verbal understanding) and the right is more “feeling” (discriminates pitch and intensity). There are many other functions in the brain but those locations are the most accurate since electrodes sit directly on those areas.
Approach/Avoid
The last geographical analysis tool we will discuss may not be accurately determined with a Total Brain Activity Map. The feelings of being willing to approach or hoping to avoid can be estimated from the front right and front left activity of the brain in the ALPHA power band (or level of thought). Read about Levels of Thought here to understand how to create an alpha brain map.
Orientation to Approach a Positive Outcome
When the front left brain activation is greater than the front right in the alpha power band (Learning Level of Thought) then you have an orientation to approach a positive outcome. This indicates that you are motivated by a desire to achieve a reward or move toward a goal. This does not guarantee success during performance but you can perform well in this mindset.
Orientation to Avoid a Negative Outcome
When the front right brain activation is greater than the front left in the alpha power band (Learning Level of Thought) then you have an orientation to avoid a negative outcome. This indicates you are motivated by the need to avoid failure. This does not guarantee success during performance but you can perform well in this mindset.