
The Opti Data Portal is a great resource for you do export the data you record from your Opti Brain collections and Opti Train trainings into a spread sheet to perform your own data analysis and statistics.
Where do I find the Opti Data Portal?
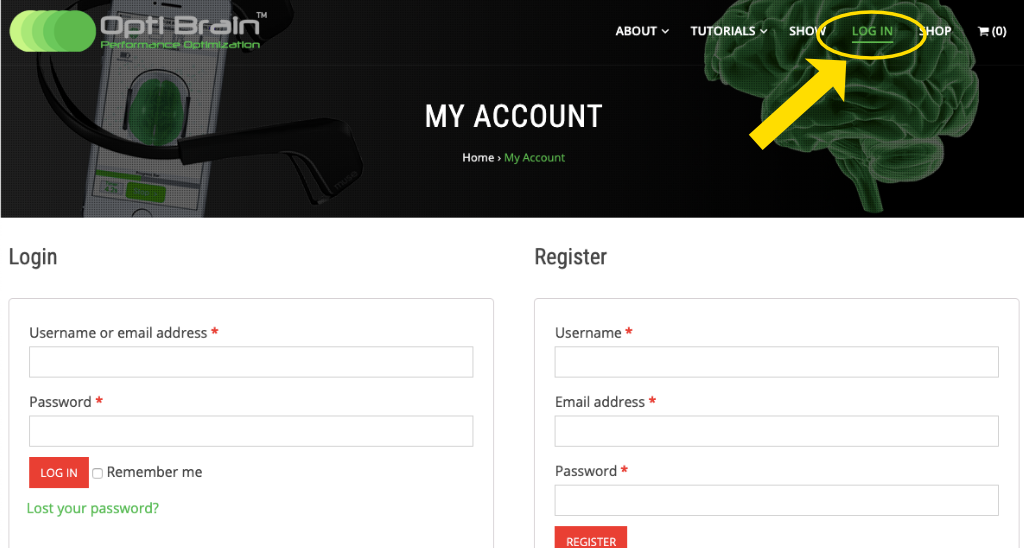
Go to the www.myoptibrain.com login page. Login with the username and password you created when you purchased an Opti Software Subscription.
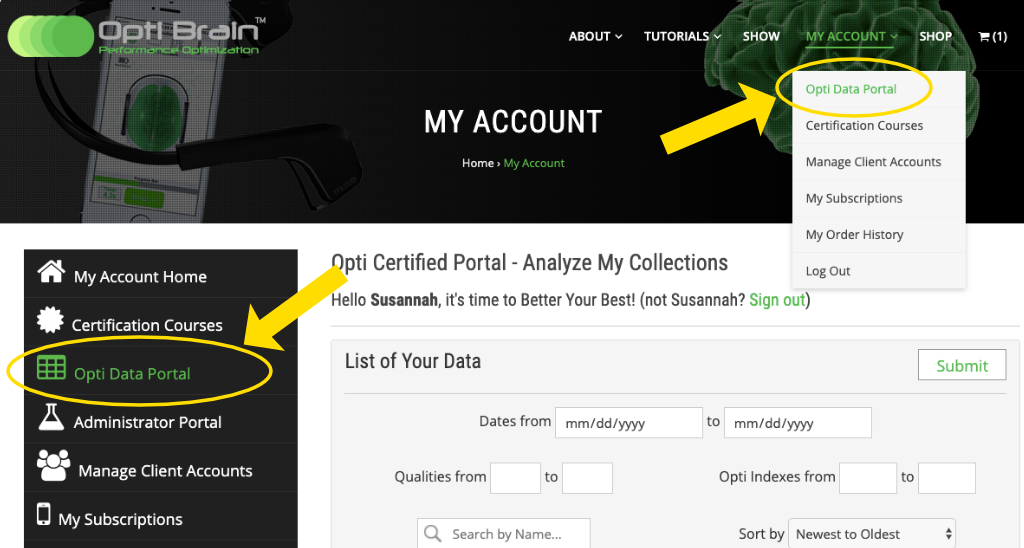
Either in the menu on the left of the screen or in the drop down menu under My Account in the top right of the screen, select Opti Data Portal.
Downloading Data
You will be able to download any collections you have saved in Opti Brain and any trainings you have saved from Opti Train, Calm or Confidence. In the Opti Data Portal you will find a list of your collections and trainings in the center of the screen.
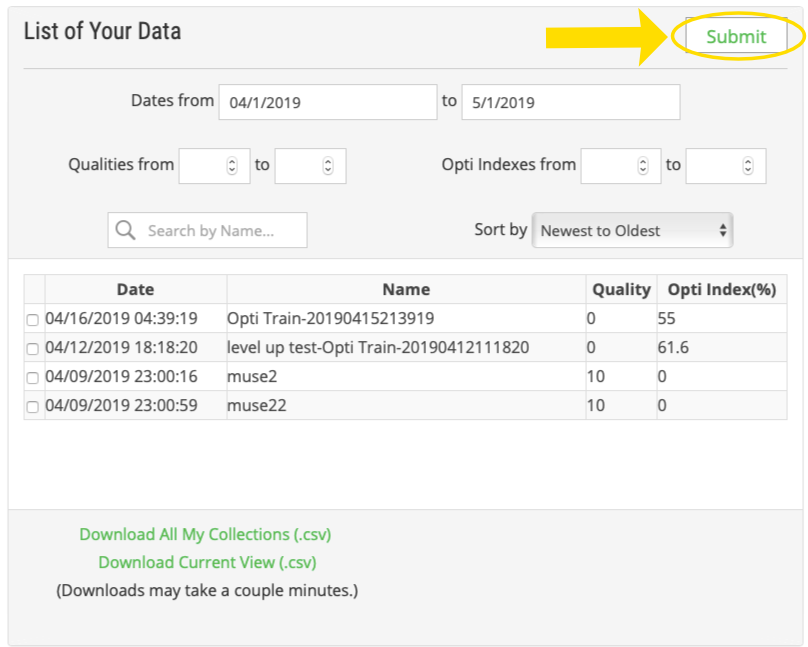
Above the list of collections you have the option to filter and sort collections. You can filter or sort by date, name, quality rating, or Opti Index. Select the submit button to apply any filter or sort changes you have made.
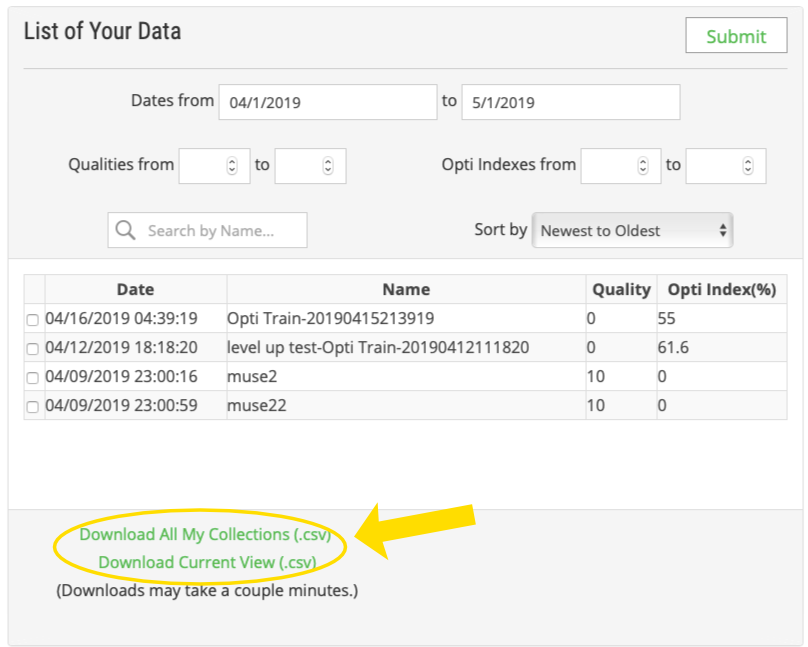
Underneath the list of collections there are two links. One allows you to download all the collections into a csv file. The second will download the collections you see on the screen after a filter has been performed into a csv. A csv file is viewable in Microsoft excel or any other spreadsheet software.
It may take several seconds or minutes for the data to download depending on how large your database is.
Understanding the CSV File
Each file downloaded has a wealth of information that is automatically calculated for your use! The csv file downloaded to your computer will be titled “report.csv.” When opened it lists all of the collections and trainings downloaded in rows. Only you have access to and can download your own collections (groups that purchase multiple Client Accounts can also access Client Account data on the Admin Account). Below is an image of what a typical data file looks like.
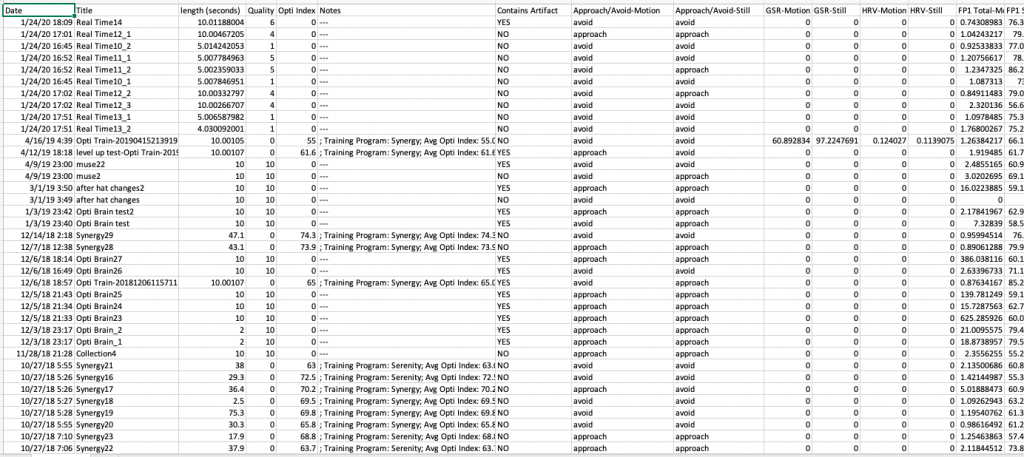
There are over 60 columns of data available for you to use in calculations, correlations and statistics. The first row of the file contains headings for every column to help you distinguish what data is important to you. In addition, below is a table detailing each column and how it is calculated for you reference.
| Date | The date and time the collection was started |
| Title | The name that was assigned to the collection |
| Length (seconds) |
How long the training or collection lasted |
| Quality (Opti Brain Only) |
The quality rating assigned in Opti Brain to a collection (see Comparing Maps and Quality Rating) |
| Opti Index (Opti Train Only) |
This is the score you received after the Opti Training ended. The Opti Index is calculated every 1s epoch (see Still vs In Motion Mapping) by averaging the Opti Index value of each electrode together (FP1, FP2, TP9, TP10 in Muse Headset). Then the average Opti Index score for the entire training is calculated by averaging the score for every epoch containing no artifact. |
| Notes | These are the notes you recorded in Opti Brain or some general information saved automatically in Opti Train |
| Contains Artifact | |
| HRV – motion – still |
Muse does not contain HRV sensors so the still and motion HVR columns will be zero |
| GSR – motion – still |
Muse does not contain GSR sensors so the still and motion HVR columns will be zero |
| Approach/Avoid – motion – still |
|
| Total – FP1 (motion, still) – FP2 (motion, still) – TP1 (motion, still) – TP2 (motion, still) |
The total power that occurred in one electrode position during a 1s epoch -Motion: last epoch of collection only -Still: average of all 1s epochs during entire collection |
| Synergy (%) – FP1 (motion, still) – FP2 (motion, still) – TP1 (motion, still) – TP2 (motion, still) |
Train Opti Index calculation in one electrode for a 1s epoch -Motion: last epoch of collection only -Still: average of all 1s epochs during entire collection |
| Serenity (%) – FP1 (motion, still) – FP2 (motion, still) – TP1 (motion, still) – TP2 (motion, still) |
Calm Opti Index calculation in one electrode for a 1s epoch -Motion: last epoch of collection only -Still: average of all 1s epochs during entire collection |
| Delta – FP1 (motion, still) – FP2 (motion, still) – TP1 (motion, still) – TP2 (motion, still) |
The power between frequencies 1Hz-3Hz that occurred in one electrode position during a 1s epoch. -Motion: last epoch of collection only -Still: average of all 1s epochs during entire collection |
| Theta – FP1 (motion, still) – FP2 (motion, still) – TP1 (motion, still) – TP2 (motion, still) |
The power between frequencies 4Hz-7Hz that occurred in one electrode position during a 1s epoch. -Motion: last epoch of collection only -Still: average of all 1s epochs during entire collection |
| Alpha – FP1 (motion, still) – FP2 (motion, still) – TP1 (motion, still) – TP2 (motion, still) |
The power between frequencies 8Hz-12Hz that occurred in one electrode position during a 1s epoch. -Motion: last epoch of collection only -Still: average of all 1s epochs during entire collection |
| Beta – FP1 (motion, still) – FP2 (motion, still) – TP1 (motion, still) – TP2 (motion, still) |
The power between frequencies 13Hz-30Hz that occurred in one electrode position during a 1s epoch. -Motion: last epoch of collection only -Still: average of all 1s epochs during entire collection |
| Beta 1 – FP1 (motion, still) – FP2 (motion, still) – TP1 (motion, still) – TP2 (motion, still) |
The power between frequencies 13Hz-20Hz that occurred in one electrode position during a 1s epoch. -Motion: last epoch of collection only -Still: average of all 1s epochs during entire collection |
| Beta 2 – FP1 (motion, still) – FP2 (motion, still) – TP1 (motion, still) – TP2 (motion, still) |
The power between frequencies 21Hz-30Hz that occurred in one electrode position during a 1s epoch. -Motion: last epoch of collection only -Still: average of all 1s epochs during entire collection |
| Gamma – FP1 (motion, still) – FP2 (motion, still) – TP1 (motion, still) – TP2 (motion, still) |
The power between frequencies 31Hz-60Hz that occurred in one electrode position during a 1s epoch. -Motion: last epoch of collection only -Still: average of all 1s epochs during entire collection |