Opti Train, Calm and Confidence Maps

Opti Train, Calm and Confidence Maps

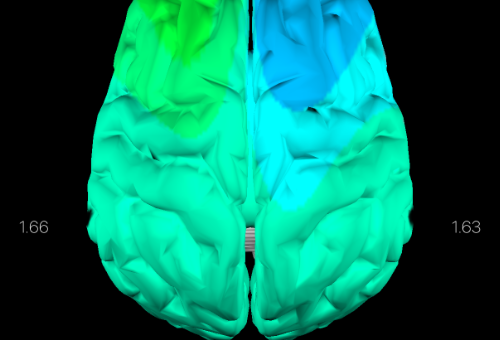
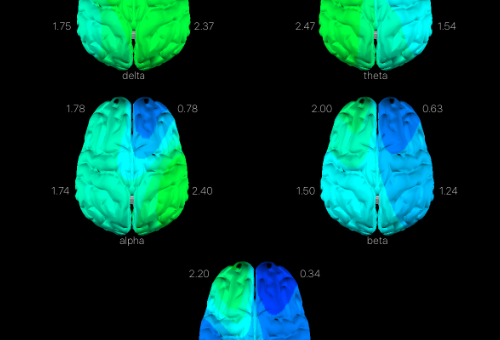
Opti Train The Opti Train brain pattern is produced when all your Levels of Thought are producing the same pattern of colors on a brain map, or in other words when all your Levels of Thought are balanced. Below are examples of maps that have high synergy values. The Opti Train Index does not use gamma or delta levels of thought in its calculation, so we will be looking at example maps containing theta, alpha, beta 1 and beta 2. When the colors on these four maps look alike they are in balance. It is of course impossible to train the levels of thought to be exactly the same, so the Opti Index will never be 100%.  High Opti Index values tend to be in the 80%'s. The above images…
Read More
Brain Map Movies

Brain Map Movies

The newest Opti Brain mapping feature is second by second movies. Setup a movie in Opti Brain by selecting the brain with a play/pause icon inside. When the brain map is played, it updates every half second to a new map. One map represents one epoch of data. To understand exactly how playbacks work it is important to understand what an epoch is. Epoch An epoch is one short time burst of brain data. When brain waves are analyzed they are divided into epochs to make analysis simpler. In Opti Brain apps, all epochs are 1 second in length. The 1st second of data from the collection is the 1st epoch, the 2nd second of data is the next epoch, all the way until the collection ends. Each 1 second…
Read More
Comparing Maps and Quality Rating

Comparing Maps and Quality Rating

A powerful tool Opti Brain offers is to analyze the brain maps from two sets of data collections at the same time. Select the icon featuring two brains to turn on compare collections. Then tap either button 1 or button 2 to select a brain data collection. Last tap the Map button to create the maps. Before and After A helpful method of comparing maps is to take a resting measure before and after an event, action or mood change. An example of this is to take resting measurements before and after a performance, a work out, a motivational speech, therapy, a massage, or a stressful situation. Map both resting collections next to each other and look for patterns. Comparing Performances When it comes to performance, the compare maps option…
Read More
Still vs In Motion Mapping

Still vs In Motion Mapping

Most brain activity research and software focuses on collecting brain data while sitting still and either meditating or performing logic puzzles. However, Opti Brain differs from this because we specialize in collecting brain data while your body is in motion!  You may be interested in collecting brain data while doing many different activities. We will help you understand how to analyze your brain maps depending on what you are doing.  To make things simple we will categorize every type of brain data collection into “resting” or “in motion”.  After finishing a collection, go to the mapping tab to setup your map. If you collected while “resting” then make sure you select the chair icon. If you collected while “in motion” select the shoe icon. Resting Collections Resting collections take place…
Read More
Total Brain Activity

Total Brain Activity

Your total brain activity is the total amount of electrical activity produced by your brain. Warm colors correspond to high brain activity and cold colors represents low brain activity. If the map shows red your brain is fast at work in that area! We are interested in both the amount of activity a brain map shows and in finding patterns in the colors. Since the Total Brain Activity maps represent all the power detected in the brain during 1 second of data, it is easiest to divide the brain into significant geographical locations when looking for patterns. Activity in specific locations of the brain can be significant indicators of the type of functions going on in your brain.  It is also very popular to divide the brain into power bands…
Read More
Levels of Thought (Power Bands)

Levels of Thought (Power Bands)

When mapping your brain, instead of dividing the brain activity up by geographical areas, it is common to divide it up into power bands or Levels of Thought. The icons with four or five multi-colored brains will map brain activity divided into levels of thought. Each of the maps represents the same brain mapped four or five times. All the brains also map the brain activation during the same time period. However, each map is the brain activation of a specific Level of Thought. The Level of Thought in scientific terms represents the total power (or brain activation) for a specific frequency. One particular map only shows the activity that occurred in that area of the brain in between a particular frequency range. Scientists have found that particular types of…
Read More